4 Strategies for Increasing the Value of your Optimization Program
Let’s assume that I am the VP of eCommerce at a Retail Company. I am heading into a meeting with the CEO, the VP of Ecommerce, and her peer group of the other VPs in the company. I have 30 minutes to brief the group on the past month of A/B testing results. What kind of experience do I want this group to have today? I do want to create a visual presentation that is elegant, yet doesn’t go too far into the weeds. Below is a framework that you can leverage to ensure you deliver value and ensure that your group has a great experience each and every time you are in front of them presenting the results of your hard work.
STRATEGY #1 – SIMPLIFY
When presenting A/B test results to the senior leadership of your company, the adage of “less if more” absolutely applies. This is especially true if you have a lot of information to cover. I have been in meetings with a client’s senior leadership team where too many details were being shown on each A/B test result slide…there were 15 tests to cover!!! Needless to say, the right information was not conveyed and it just was not a value-added meeting for the team. You may think you need all the data up front, but you don’t. Figure 1 below is a slide taken from an A/B test results review with a senior leadership team. The primary KPI – Content Interaction – is clearly called out. The only other metric that reached confidence is the Begins metric. Again, you can convey your message clearly and powerfully without showing a lot of data and words here.
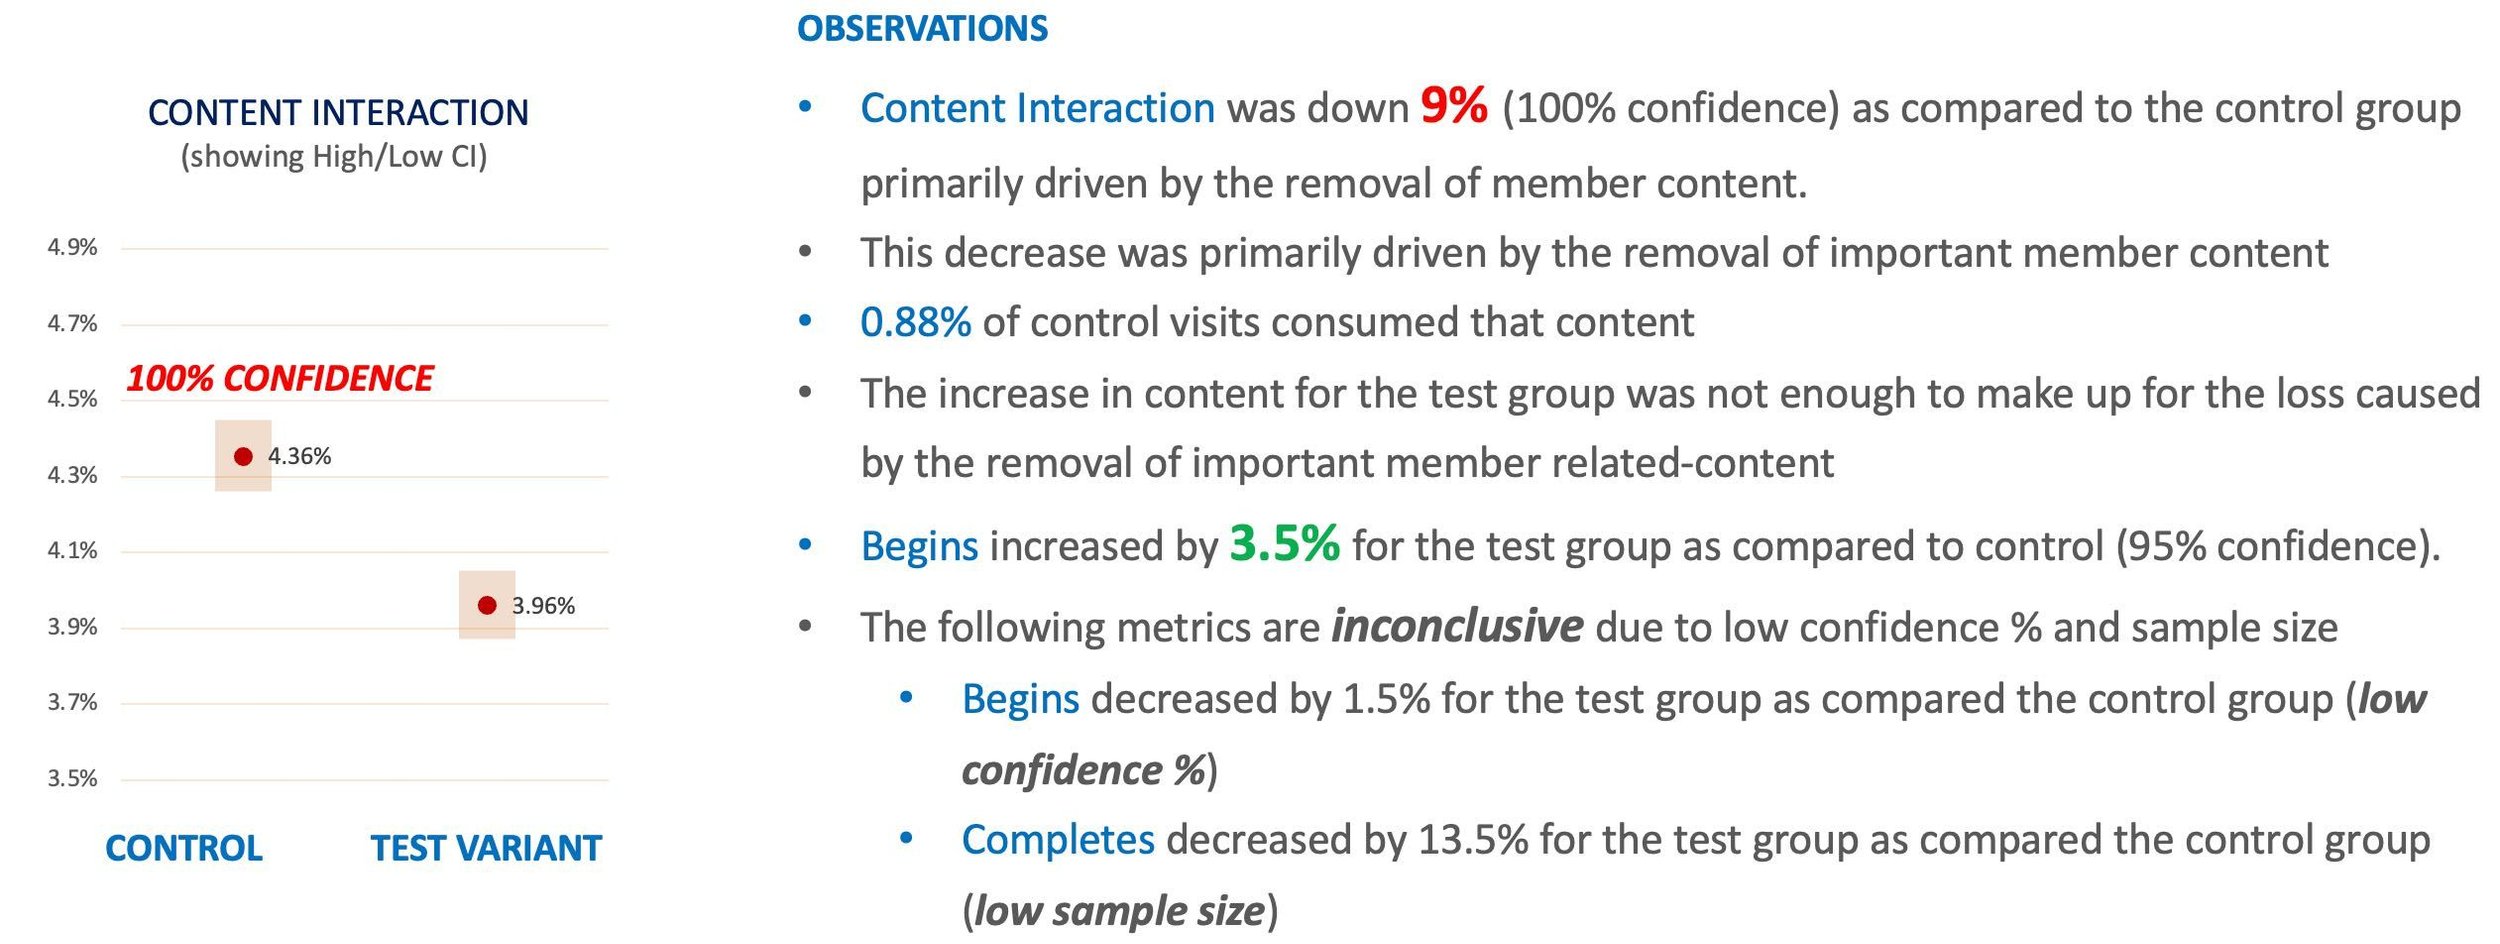
FIGURE 1: A/B TEST RESULTS SLIDE
Here are a few things to keep doing and a few to stop doing.
⭐️ Keep an appendix with all of the details that you feel you may need to answer deep dive questions
⭐️ Keep a running estimate of the annual program impact (For ideas on how to do this, check out the article ‘Quantifying the Impact of Your Optimization Program’
⭐️ Keep using impactful screenshots of the Control and Alternative experiences, including above the fold lines
🗑 Toss too many metrics/data on the primary test results slides
🗑 Toss the details behind the calculations as you can put those in the Appendix as well
🗑 Toss using words to describe the alternative experiences, use screenshots instead as you will create more interest
STRATEGY #2 – DEFINITIONS
Ensure that you and your audience agree on the meaning of a few terms for A/B testing and statistics that will be in all of your presentations. I’ve also experienced the derailment of more than a few meetings over the correct definition of 95% confidence for a test result. It’s a conversation that can go down a rabbit hole if you’re not careful. The more you are able to get everyone to understand the A/B testing language, the more clarity will appear around your results and insights. Below is a surprisingly important word to define with your leadership team. If any of the metrics you are tracking for the A/B test do not reach the planned confidence level – say 95% - then the results are “inconclusive.” This is a tricky one, because if a test variant lift is at 75% confidence as compared to the control group, then most leaders will say “Oh, yes, so we are having a positive impact let’s push this one live!” No, no, no. We cannot make a conclusion on these metrics. We’ll discuss why this is so using confidence intervals in our presentation for each A/B test result.

FIGURE 2: MERRIAM-WEBSTER DICTIONARY
⭐️ Keep talking about your definitions during your meetings to ensure everyone is continually on the same page
⭐️ Keep reinforcing that the word “Inconclusive” is not necessarily bad, there are still learnings there
⭐️ Keep studying statistical definitions to ensure you are prepared for any questions such as “What is a Type I error?”
🗑 Toss too many definitions, decide on your top 3
🗑 Toss skipping quickly over inconclusive tests and not finding awesome insights
🗑 Toss not putting the time into honing your statistical knowledge
STRATEGY #3 – ACTIONABLE INSIGHTS
If roughly 25% of A/B tests produce a clear statistically significant winner, what about the other 75% of the A/B tests you have run? I’ll say that once again as this is a statistic you will want to know. Roughly 25% of A/B tests produce a clear statistically significant winner. What does this mean really? It means you have some work to do on the other 75% of the A/B tests that you run on the site in order to pick up maximum value for your program.
This is where the art and craft of your work comes into play. It is fairly easy to produce a table of results for all of your metrics for these tests. And, I have seen more than a few A/B testing meetings get stale over time because the only exciting results are the ones for test winners. Then, people stop attending meetings and stop contributing to the growth of your program. Actionable insights are the key to keeping your A/B testing program on a forward growth trajectory as well as maintaining the funding and support for the program.
In another blog post, I will talk about the importance of creating a Test Brief for each A/B test that you run. In that brief you will not only have your primary and secondary KPIs as well as any leading indicators, you will also have any Audiences that are important to the business. These two tactics will help you tease out actionable insights of your “non-winners.” I have seen many A/B testing managers look like Rock Stars when they delivery actionable insights to their senior leadership team.

Here's an example. We discovered in the data that visitors that read a free newsletter are more engaged with content and read more articles overall as compared to those visitors that do not engage with newsletters.
This is a great insight! But how do we make it actionable? Be prepared to show a few ideas on how to run a test iteration for just Newsletter viewers. The senior leadership team may not pick your test idea, but it will lead to a great discussion.
⭐️ Make sure you have primary and secondary KPIs as well as any leading indicators in your Test Brief
⭐️ Capture any audiences that are important to your business and segment the data based upon those audiences to tease out actionable insights
⭐️ Show your senior leadership team 2-3 test iteration ideas based upon the actionable insights
🗑 Only having a single KPI. Yes, you’ll need a primary KPI to call the test on. You’ll need the others in order to deliver actionable insights.
🗑 Only looking at the results for “All Visits”
🗑 Giving up on a test without exhausting potential test iterations
STRATEGY #4 – CONFIDENCE INTERVALS
In my 10+ years in the industry, I have learned and experienced directly through meeting with senior leadership teams that confidence intervals are the hidden gem to not only positioning yourself as a statistics expert, but also to help your team gain trust in the data and the program. You may be thinking isn’t this too far into the weeds? Absolutely not. If you handle this one properly, then it will actually keep everyone out of the weeds of statistics. Further, if you explain to this group about the importance of reviewing confidence intervals from the standpoint of risk reduction and not unnecessarily harming sales, then that will also go a long way.

Be able to explain what the CONFIDENCE INTERVAL blue bar represents
This goes back to our discussion around the definition of “inconclusive” earlier. In this specific example, the results are indeed inconclusive.
More importantly, some leaders will say “Well, 4.33% is really close to 4.36% and I like the new design so let’s push it live.” The senior leader needs to understand that the blue bar represents the range of possible outcomes for the Depth of Visit metric. Meaning, it could be as low as 4.22% - which is far from 4.36%.
⭐️ Always include confidence internals for your primary KPI to clearly explain what statistical significance means and it’s importance in minimizing risk
⭐️ Consider using confidence intervals for all of your metrics
⭐️ Have the definition of confidence internal down pat and be able to explain how using it avoids costly mistakes
🗑 Not showing confidence intervals at all
🗑 Doing surface level analysis on other test metrics
🗑 Avoiding discussions around the basic definitions of statistical terms
I threw a lot at you here. Following these four strategies has many benefits. First, you will create a great experience for your senior leadership team each and every time you review your A/B testing results with them. This is huge! Secondly, you will position yourself as an expert in what you do. You are showing strategic thinking as well as strategic planning out test iterations instead of simply regurgitating the test data. Finally, you are ensuring that you are aligned not only with the hypothesis for each A/B test, but also with the customer experience on the site to ensure that you are getting the answers that both you and your senior leadership team are seeking.
Happy Testing!