Using Sample Size Estimates to Build an Optimization Roadmap
You have put a tremendous amount of effort into compiling a prioritized list of test ideas for your Optimization roadmap. It’s taken months to build and includes data analysis, coordinating and facilitating ideation sessions across the organization, and ranking test ideas based upon potential impact. Now you are tasked with building out the Optimization roadmap on the calendar for the next several months and now you are to deliver your strategy to your VP……but, you’re not quite sure how to plan all of these test ideas into an integrated schedule on the calendar. Not to mention the complications that come with running overlapping tests on the same site pages.
This is where Sample Size calculations come in handy. The benefit of a Sample Size calculation is that it gives you a good estimate of how long your test needs to run in order to reach statistical significance in the data, which results in more accurate project planning overall.
Let’s discuss a few use cases for Sample Size calculations, as well as steps on how to properly perform one.
USE CASE #1 – IT RELEASE COORDINATION
Let’s say you have an IT release coming up in 2 weeks and you want to know whether or not to launch your test before or after the release is complete. Running a Sample Size calculation for your test will help you make a sound decision on when to launch. For example, if your Sample Size calculation result is 3 weeks, then now you know that you should wait until after the IT release is complete to launch your test.
USE CASE #2 – SAME PAGE TESTS
Another example is when you have several test ideas that you want to run on the same page, for example your Product Detail Page (PDP). If you don’t have enough traffic to your site, you may to run these tests sequentially, as compared to using test swim lanes to run mutually exclusive tests at the same time. You can now map out when to start and stop each PDP test on your calendar.
USE CASE #3 – NUMBER OF TEST VARIANTS
There may be tests that you want to run that have more than one test variant. What if your design team comes up with 5 test variants? How will that impact how long you have to run your test? You can run your Sample Size calculation a few times depending upon the number of test variants, which will give you an idea of how much longer a test would need to run to reach statistical significance depending upon how many test variants are in play. The more test variants you have, the longer the test will need to run to reach statistical significance.
USE CASE #4 – CHANGING PROMOTIONS
A final use case is when you have promotions changing every 2 weeks on your Home Page and you want to run a test on your Home Page. When should you launch your test so that it is not still running during a promotion change? You run a Sample Size calculation and determine that your Home Page test needs to run 1 week in order to reach statistical significance. Now you can time your test launch so that it does run during a Home Page promotion switch.
Now that we’ve reviewed a few use cases, let’s dig into how to actually calculate your Sample Size. First off, there a few data inputs that you need to gather in preparing to run the calculation.
DATA INPUT REQUIRED
Confidence level: % of time that you would get the same results if the test were repeated
Statistical power: How likely the test is to distinguish an actual effect from one of chance
Baseline conversion rate: The conversion rate for the control group
Daily visits to test page: Daily traffic to the test page
# of offers: # of test variations including the control group
Test lift assumption : Your estimate of the impact lift of the test variant
Once you have the data inputs above, you can perform your Sample Size calculation. HERE is one that we like to use from Adobe Target:
SAMPLE SIZE CALCULATION
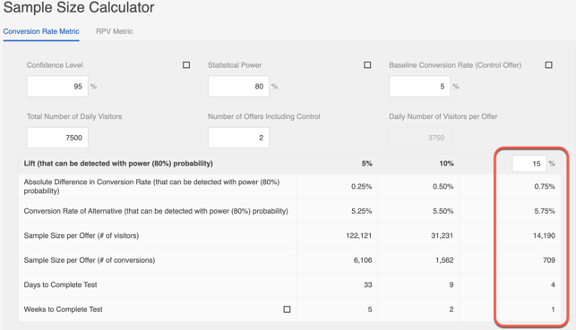
Here are the data inputs for the example Sample Size calculation above:
Confidence level: 95%
Statistical power: 80%
Baseline conversion rate: 5%
Daily visits to test page: 7,500
# of offers: 2
Test lift assumption: 15%
So what do the results tell us? In this case, you would want to run your test for 1 week in order to reach statistical significance, assuming a 15% lift in conversions as compared to your control group.
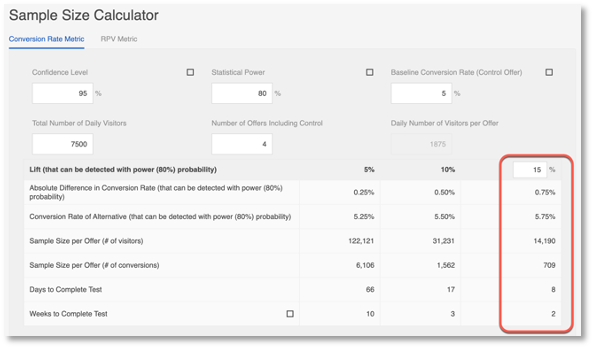
In one of our use cases above, we discussed how the # of test variants could affect how long the test needs to run to reach statistical significance. You just got an email from the Design team requesting that another 2 design variations be added to your test and you’re curious as to whether or not this change will have an impact on the test run length that you calculated above. So you re-run the Sample Size calculation, this time using 4 variations including control, and you determine the test will have to run an additional week – 2 weeks in total – in order to reach statistical significance.
Bonus Material:
(1) Stop your test once you reach the estimated test run length so as to avoid any Type I errors in your test results.
(2) Re-run the Sample Size after a few days with live data from the test and see if this changes how long your test should run. Sometimes, the data from analytics used for your assumptions can differ from what the test is actually showing.
You now have an awesome tool in your Optimization toolbox to help you map out a well thought-out, data-driven, and successful testing roadmap.