
ChatGPT Sent You Traffic on May 7. The Question Is What For.
On May 7, ChatGPT turned brand mentions into clickable links and referral traffic jumped. The spike everyone is quoting is an average, and an average describes no brand exactly. Six questions to ask of your own data to find out what the change did to yours.
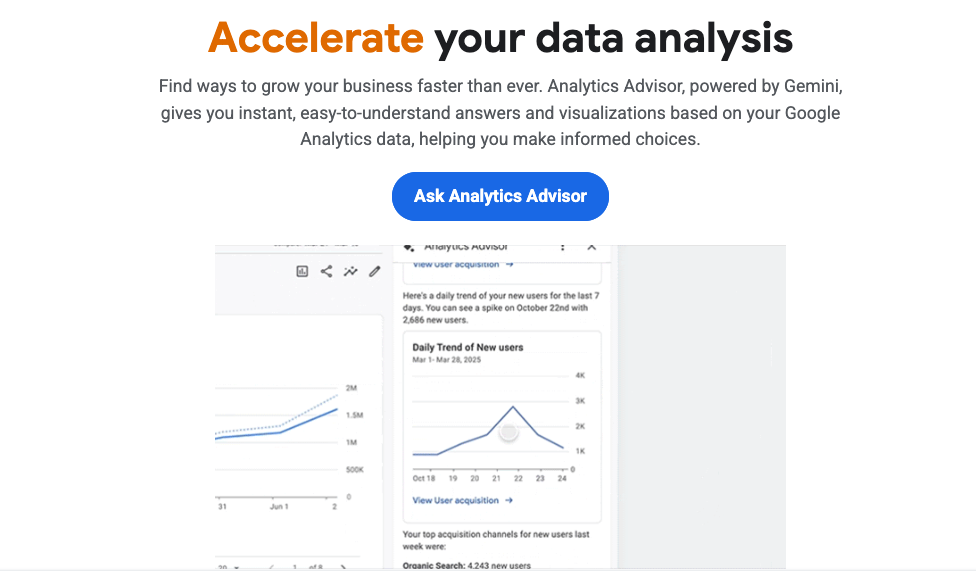
We Took Google's New AI Analyst for a Test Drive
Google is actively marketing Analytics Advisor, pitched as your "always-on data analyst." It's the latest in a wave of vendor AI tools prompting brands to reconsider how they staff analytics work, and in some cases, to replace humans with tools like this one. Before drawing conclusions, we ran it through four kinds of questions against real enterprise GA data: reporting, diagnostic, strategic, and anomaly. The results were more nuanced than the marketing suggests.

Data Theater: What McKinsey's AI Report Actually Says (And What LinkedIn Gurus Won't Tell You)
McKinsey's latest AI research is everywhere on LinkedIn: "57% of jobs automated! $2.9 trillion opportunity!" But the viral posts are cherry-picking stats and stripping context. We read the actual 60-page report. Here's what decision-makers need to know instead.

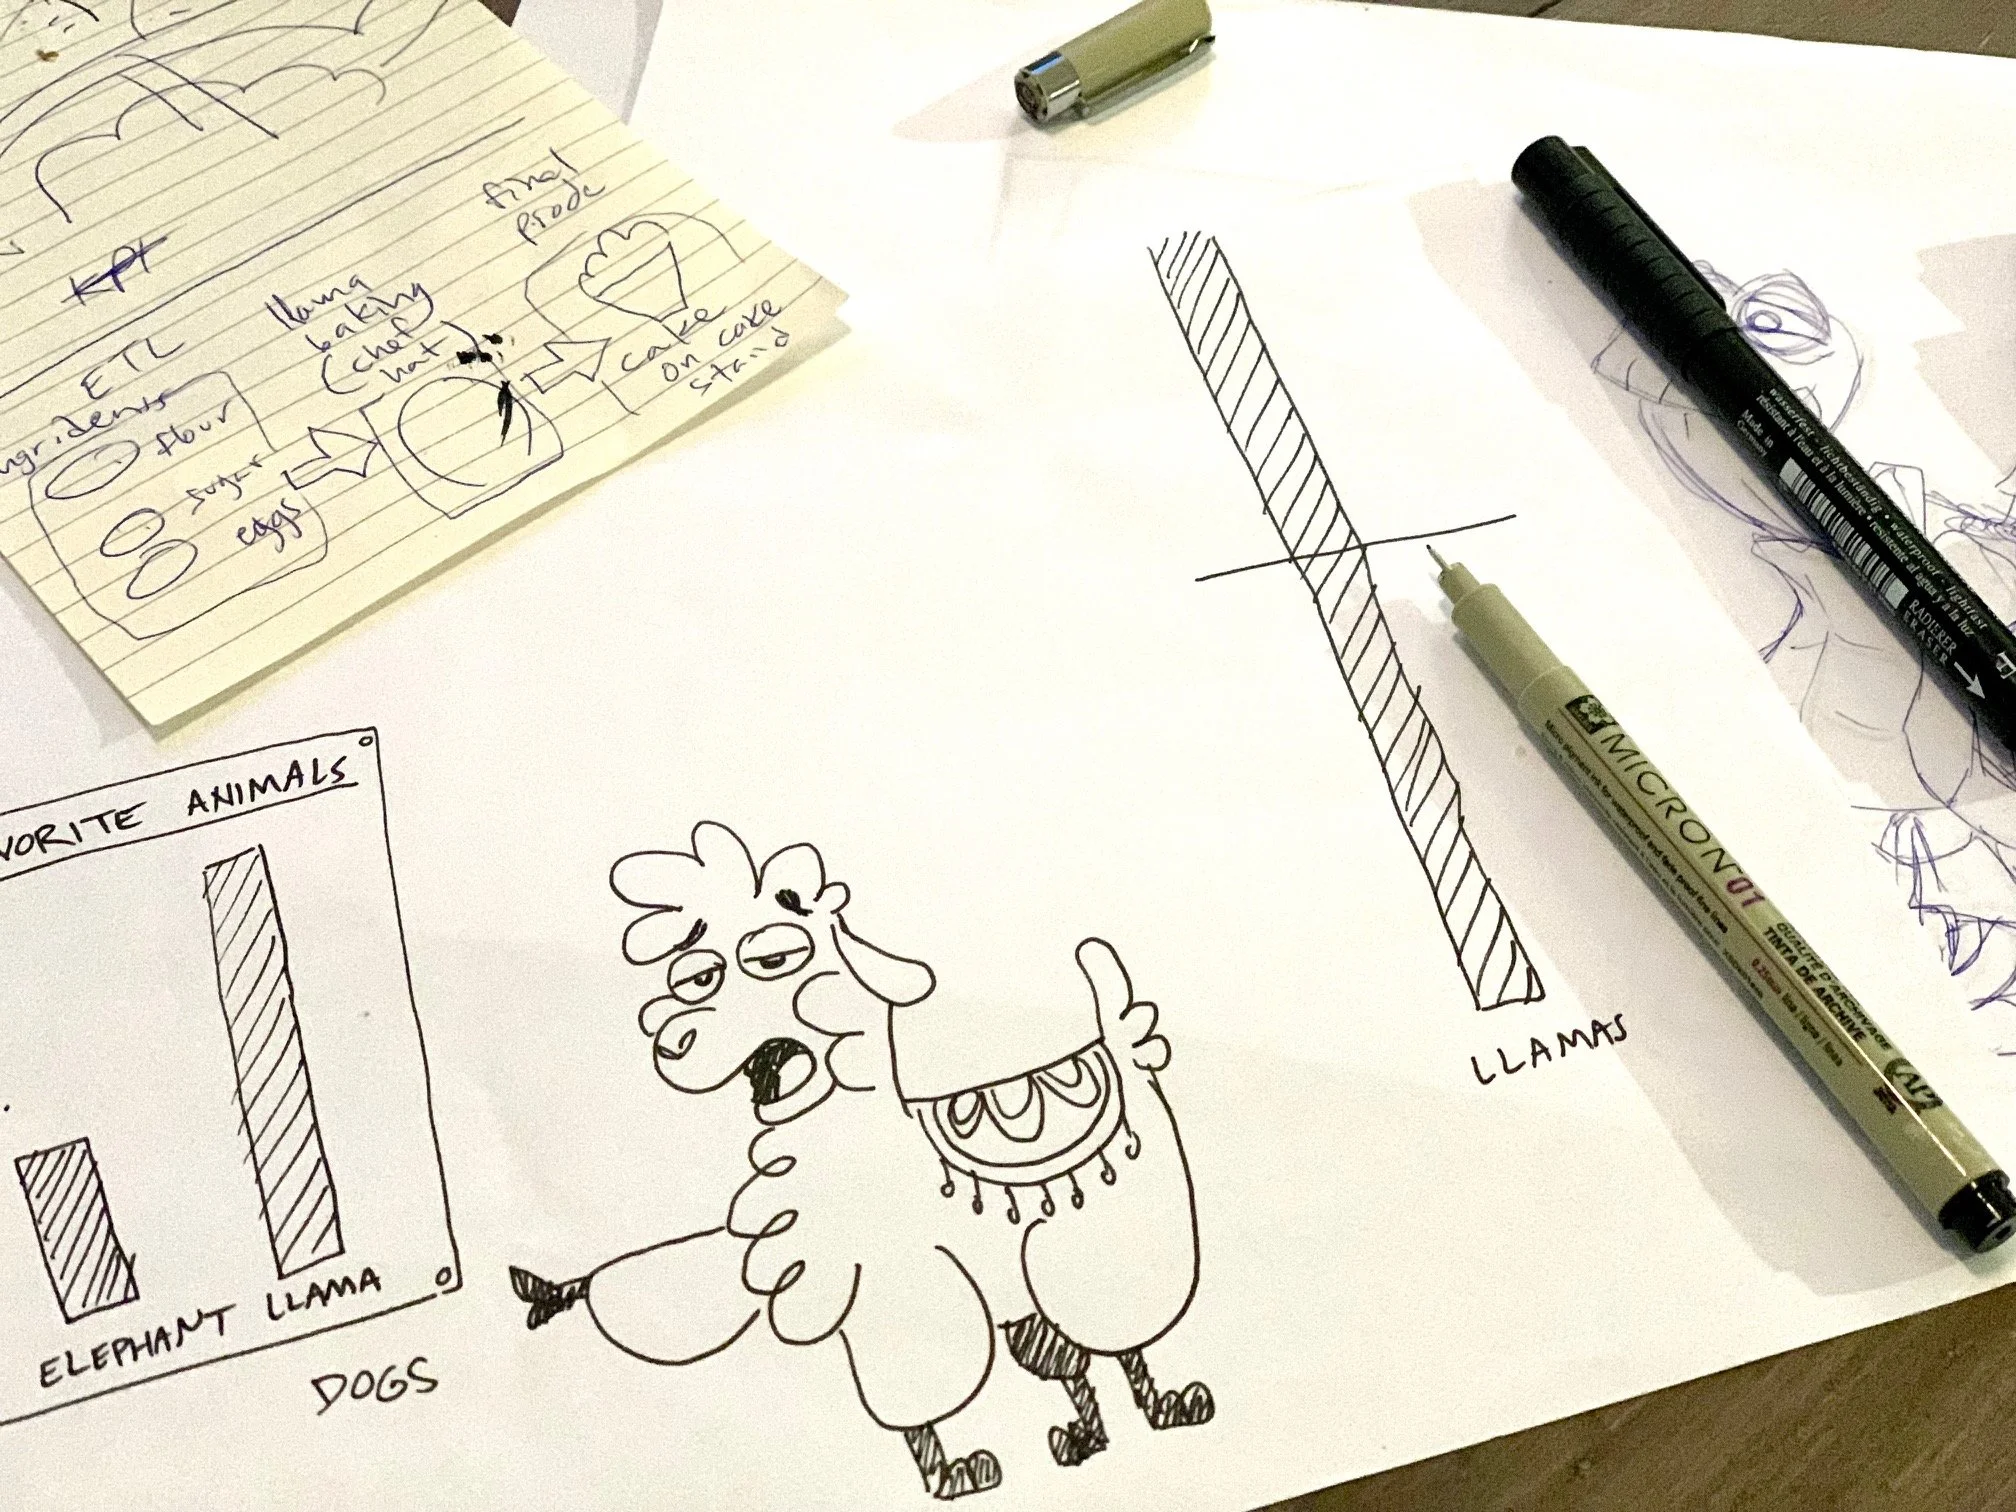
We Asked 3 LLMs to Build a Data Viz. Here's What Happened.
If you've been on LinkedIn lately, you've probably seen your fair share of posts about how "AI will replace your analysts!"
"ChatGPT just made my whole data team obsolete!"
We got curious. Not about whether AI can theoretically do analysis, we know it can be a very useful tool, but whether it can deliver an actual work product. The kind of thing a marketing director might hand to their exec team. So we ran a simple test.

How to spot when someone cherry-picks data to tell you what they want you to believe.
We seen it used on several Subreddits, it made rounds on Facebook, and of course it has been shared ad nauseam by LinkedIn thought-leaders. But do the charts, as one poster on LinkedIn put it, make it obvious that we are not in a bubble?
The charts seems legit, although they have been so overshared at this point the pixel quality has clearly degraded. The numbers seem authoritative. The argument feels data-driven.
But is it obvious?
Let's break down exactly what's going on here, and more importantly, how you can spot similar red flags in any analysis you encounter.
The claim.
“If this were a bubble, we'd see massive cash burn and unsustainable growth. But the numbers show real adoption, real revenue, and real productivity. What matters is net profit growth, something that frankly wasn't there at all in the dot com bubble. This is what separates AI from past 'bubbles'."
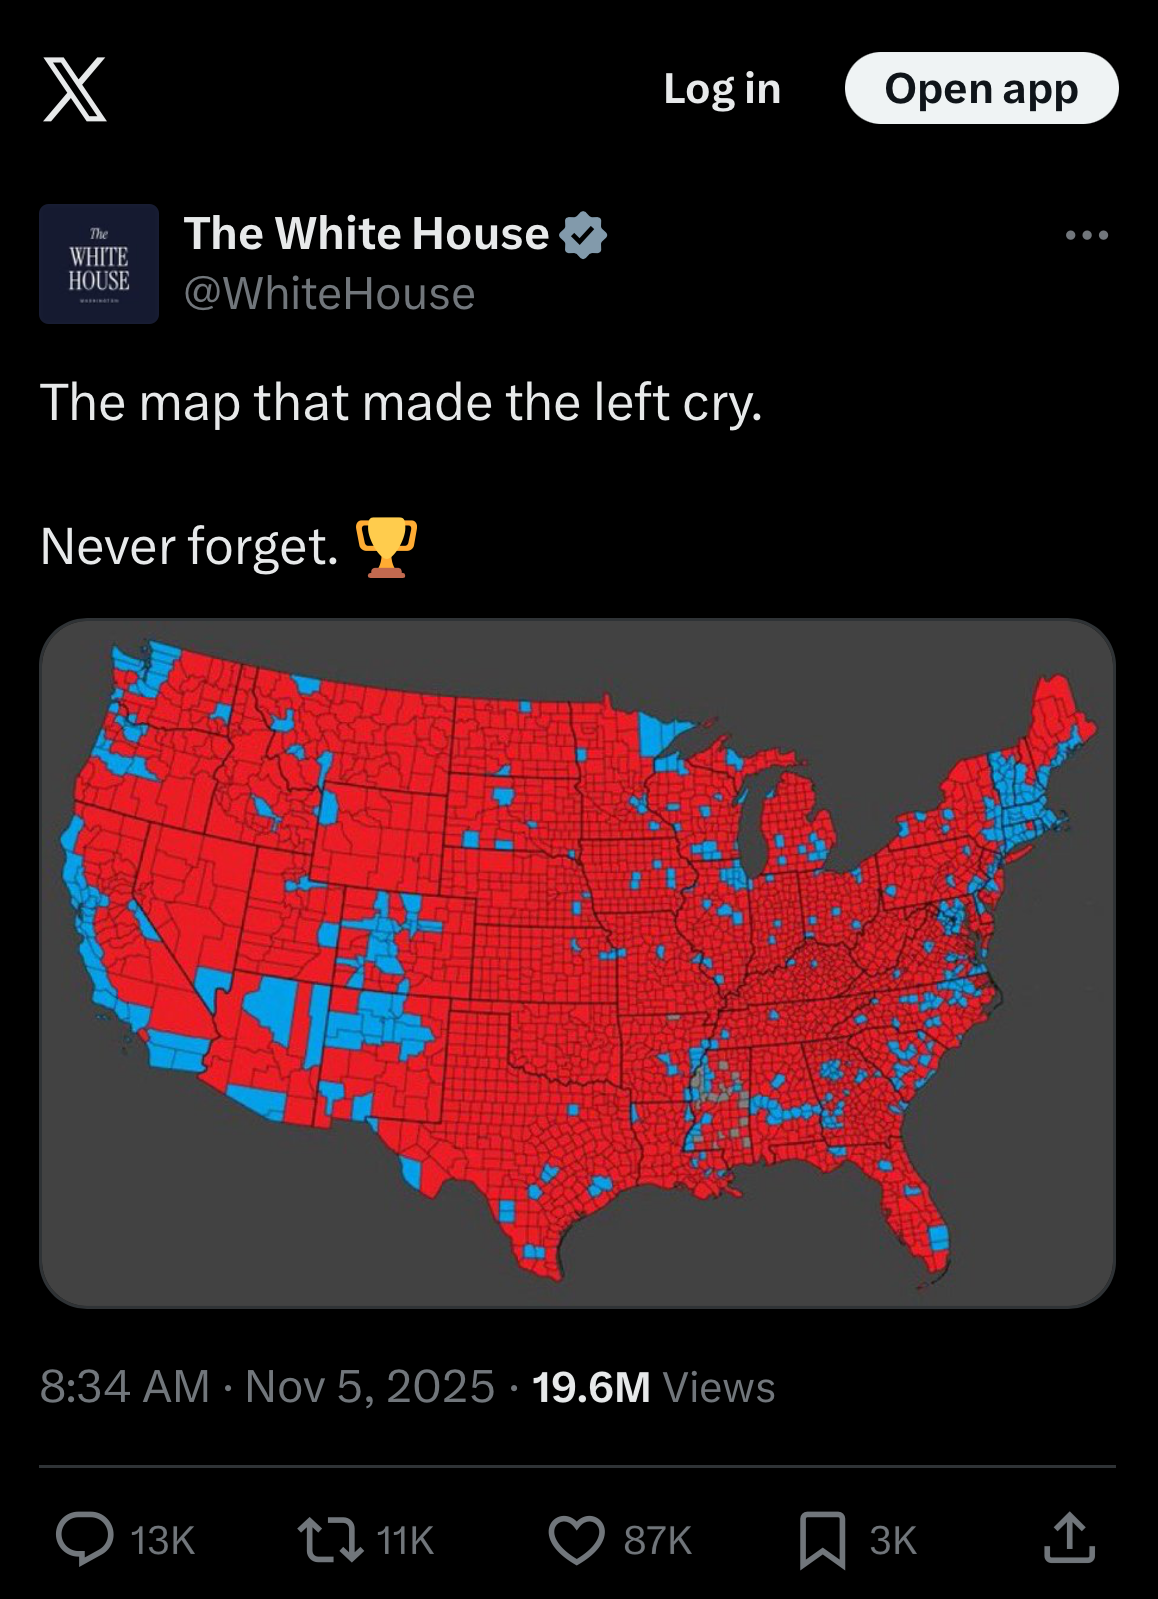
The Map That Never Dies: Why This Misleading Electoral Visualization Still Works in 2025
The White House shared a viral electoral map that's been debunked for a decade. Here's why geographic county maps systematically misrepresent election results and why they'll never die.

How to Spot Bad Data: A Case Study in Corporate Research Theater
The viral Empower survey about Gen Z salaries? Methodologically worthless. Learn the 7 red flags to spot bad data and protect yourself from misleading research.

You Don't Need to Be an Analyst to Think Like One
I need to tell you something that might change how you see yourself: you already have the capacity to be an analytical thinker. You don't need a statistics degree. You don't need to know how to query a database. You don't need to become an analyst.

When Data Becomes Disinformation: A Call for Ethical Analytics
Disinformation is not confined to politics or public health, it lives wherever data can be bent to serve an agenda. Analysts hold a unique responsibility as translators of data into action.
When we strip away context or selectively frame numbers, we risk becoming part of the same machinery that erodes public trust.
At 33 Sticks, we believe ethics cannot be optional. Our manifesto commits us to objectivity, transparency, and context because without objectivity, the true value of data is lost.

Why the Culture-War Frame Wins Headlines (and Still Misleads)
Earlier this month, Cracker Barrel unveiled a new brand identity. The familiar imagery of a man leaning on a barrel disappeared. Within hours, social media lit up and headlines followed:
“Board member under fire for DEI background after restaurant ditches traditional logo”
“Conservative activist slams Cracker Barrel; company left reeling after logo redesign”
“Marketing fiasco shows investors are making ‘woke’ a massive risk factor”
The narrative was clear, the redesign wasn’t about business strategy, it was about politics.

The Future of Digital Analytics Is Not Digital
The digital analytics industry stands at an inflection point. As generative AI and automation sweep through organizations, promising to handle everything from data collection to basic analysis, we face a fundamental question: What becomes of the digital analyst?
The answer isn't found in fighting the tide of automation or doubling down on technical skills. Instead, it requires us to acknowledge an uncomfortable truth that digital analytics, as we've known it, is already obsolete. Not because the work doesn't matter, but because the name itself has become too small for what we must now become.
What emerges from this disruption isn't the death of a profession but its radical evolution from mechanical data workers to what we call "organizational anthropologists," practitioners of Human-Centered Analytics who help businesses see the humans behind the data.

Using U-Haul’s Growth Report to Spark Better Analytical Thinking
There’s a moment in every analyst’s career when they stop just reading data and start questioning it.
We’re not talking about being cynical or skeptical for the sake of it. We’re talking about curiosity-driven, clarity-seeking, insight-focused critical thinking.
Take U-Haul’s 2024 “Growth States Report.” It ranks U.S. states based on one-way U-Haul rentals, suggesting where people are moving to and from. At a glance, it’s a tidy list with intuitive appeal. But scratch the surface, and it becomes a perfect teaching tool, not because the data is “bad,” but because it invites better questions.
So let’s use this dataset not as something to critique but as something to practice on.

Meta's New Incremental Attribution Model: Truth, Hype, or Another Layer of Opacity?
Ad agencies are buzzing about Meta’s new Incremental Attribution model with some calling it a breakthrough in “real” measurement and the end of vanity metrics.
But here’s what we’re not seeing: Critical discussion from a data perspective.

When Optimization Becomes Manipulation
A friend once remarked to me that "unintentional evil is still evil," referencing how social media platforms might not have been designed with malicious intent, yet their engagement-obsessed algorithms often create harmful outcomes. Sometimes it's not evil but simply unethical, disrespecting humans, breaking trust, or manipulating behavior.

Why We Created 'A is for Analytics'
From an early age, children are naturally curious, asking questions, observing patterns, and trying to make sense of the world around them. In our modern, data-driven society, this innate curiosity can be nurtured through tools that teach them how to think critically, analyze information, and draw meaningful conclusions. This is why we created A is for Analytics—to make the world of data accessible to kids in a fun and engaging way.

As Analysts, We Must Approach Data with Skepticism and Critical Thinking
Critical thinking and skepticism are not just optional tools for data analysts—they are essential. Without them, we risk allowing flawed, biased, or incomplete data to influence important decisions. In a world where data is used to shape narratives and drive opinions, our responsibility is to approach it with a healthy dose of doubt and a commitment to uncovering the full story.
Creating a New Data Literate Generation
Through almost 20 years of experience, one of the biggest problems we’ve observed, not just within companies but within schools, communities, and the world in general, is a frightening lack of data literacy. Not only has this lack of data literacy translated into missed business opportunities to create really positive experiences for customers, but in a more important and serious way, the lack of data literacy has allowed companies, journalists, and politicians to effectively distort data in order to create divisiveness and chaos.